
Filtration Process Validation
Filtration is a critical process step that directly influences product quality, sterility assurance, and overall process robustness. Filtration process validation demonstrates that the filtration step consistently achieves its intended purpose under defined operating conditions. Process performance verification ensures that the validated state is maintained throughout routine manufacturing.
This article addresses the validation of filtration as a process step and the structured oversight required to confirm continued performance within the established operating envelope. It does not duplicate equipment qualification or integrity test method detail, which are addressed separately.
1. Role of Filtration in the Process Control Strategy
Filtration may serve one or more of the following functions:
• Sterile filtration
• Bioburden reduction
• Clarification
• Particulate removal
• Virus reduction
• Concentration or diafiltration in TFF systems
The filtration step must be clearly defined within the overall process control strategy. Its contribution to product safety and quality must be documented through risk assessment. Where filtration supports sterility assurance or viral clearance, it constitutes a critical control point.
The validation strategy must therefore demonstrate that the filtration step performs reliably under defined worst-case conditions.
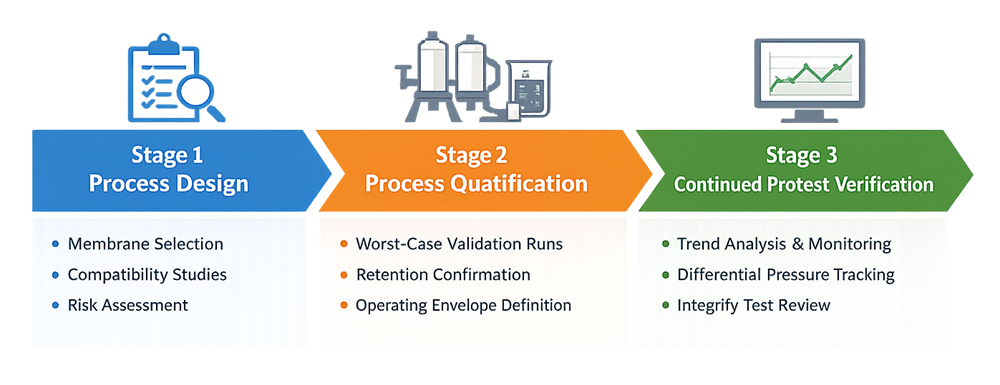
The diagram below illustrates the lifecycle framework for filtration process validation. It aligns the filtration step with the three stages of process validation: process design, process qualification, and continued process verification. The model clarifies that filtration validation is not a single event but a structured lifecycle approach beginning with membrane selection and risk assessment, followed by qualification under worst-case conditions, and sustained through ongoing performance monitoring.
2. Filtration Process Risk Assessment
Process validation begins with formal risk assessment.
Key risk factors include:
• Membrane compatibility with product formulation
• Adsorptive product loss
• Fouling behavior and flux decay
• Differential pressure escalation
• Bypass risk due to improper installation
• Integrity failure during processing
• Temperature sensitivity
Risk assessment should identify critical process parameters and define acceptable operating ranges. The filtration process must be evaluated under worst-case pressure, flow, and volume conditions that could reasonably occur during routine manufacturing.
3. Definition of the Validated Operating Envelope
Filtration validation establishes a defined operating envelope within which the process is demonstrated to perform acceptably. The validated envelope typically includes:
• Maximum and minimum differential pressure
• Acceptable transmembrane pressure range
• Defined flow rate range
• Maximum process volume
• Maximum processing duration
• Temperature limits
These limits must be supported by validation data and incorporated into batch instructions and automation setpoints. Operation outside this envelope constitutes deviation from validated conditions.
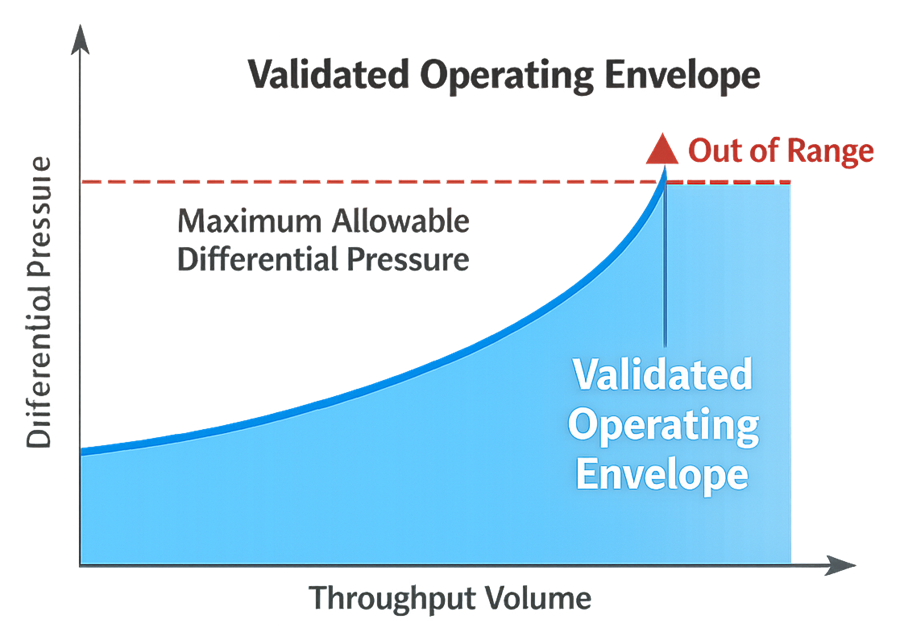
The illustration below visualizes the concept of a validated operating envelope for the filtration process. It demonstrates how differential pressure progresses as throughput increases and identifies the defined limits within which the filtration step has been validated. Operation within this envelope represents controlled, validated performance, while operation beyond established limits constitutes deviation from validated conditions.
4. Initial Filtration Process Validation
Initial validation demonstrates that the filtration step meets its intended performance criteria. For sterile filtration, validation typically demonstrates:
• Bacterial retention capability under worst-case conditions
• Correlation between microbial retention and integrity testing
• Compatibility with product and formulation
• No adverse impact on product quality attributes
For virus reduction filtration:
• Demonstrated log reduction value under defined challenge conditions
• Justification of model organism selection
For clarification or TFF applications:
• Flux stability
• Product recovery
• Fouling characterization
• Process reproducibility
Validation must include justification of worst-case conditions, including maximum differential pressure and maximum throughput.
5. Process Performance Qualification
Process performance qualification confirms reproducibility under routine manufacturing conditions. This phase demonstrates:
• Consistent pressure profiles across multiple runs
• Stable transmembrane pressure behavior
• Predictable flux or flow characteristics
• Acceptable product recovery
• No adverse impact on critical quality attributes
Performance data collected during qualification establish baseline behavior for ongoing comparison.
6. Process Performance Verification
Process performance verification confirms that the filtration step continues to operate within the validated envelope during routine production. Ongoing verification typically includes trending of:
• Differential pressure progression
• Transmembrane pressure stability
• Flow rate consistency
• Throughput volume versus pressure behavior
• Integrity test pass rates
• Alarm frequency and deviation occurrence
Trend analysis should detect gradual drift, increasing fouling rates, or instability before failure occurs. Statistical review may be applied where appropriate. The objective is early detection of degradation or variability that could compromise process control.
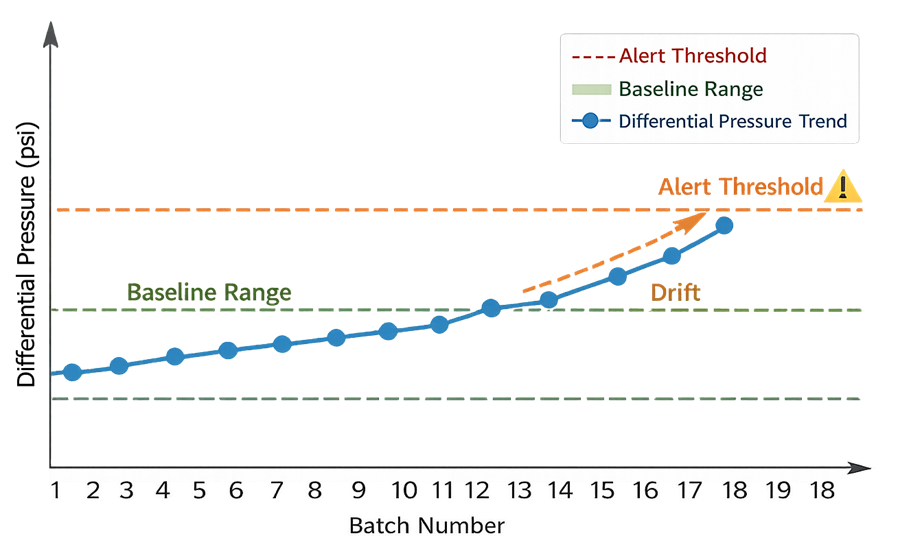
The following example illustrates routine performance trending used during continued process verification. The trend chart demonstrates how differential pressure or integrity test results are monitored across batches to confirm stability within the validated operating envelope. Progressive drift or increased variability may signal emerging fouling behavior or process instability requiring investigation.
7. Drift Detection and Early Warning Indicators
Performance verification must include identification of early warning indicators. Examples include:
• Gradual increase in differential pressure at equivalent volumes
• Reduced run time before reaching pressure limits
• Increased frequency of integrity test failures
• Unexplained alarm events
• Variability in flow control behavior
Such signals require investigation to determine root cause and potential impact on validated status.
8. Revalidation Triggers
Revalidation of the filtration process may be required following:
• Change in filter type or membrane material
• Supplier change
• Scale change
• Modification of operating parameters
• Change in product formulation affecting fouling behavior
• Repeated unexplained performance deviations
• Significant shift in performance trends
Formal change control must assess impact on validated operating conditions and determine scope of revalidation.
9. Documentation and Lifecycle Governance
Filtration process validation must be documented in a formal validation protocol and report. Documentation typically includes:
• Risk assessment
• Worst-case justification
• Validation study design
• Performance data
• Acceptance criteria
• Defined operating envelope
Process performance verification must be supported by:
• Periodic trend reports
• Deviation investigations
• Management review where required
Lifecycle governance ensures that the filtration step remains in a validated state throughout commercial operation.