
Lyophilization Process Qualification
1. Introduction
Lyophilization process qualification demonstrates that a defined freeze-drying cycle consistently produces product that meets predetermined quality attributes at the intended manufacturing scale. Unlike equipment qualification, which confirms system capability, process qualification confirms that the selected formulation, container closure system, load pattern, and cycle parameters operate together reproducibly within the qualified equipment operating envelope.
Process qualification should be executed only after completion of lyophilizer IQ, OQ, and equipment-level PQ, with acceptance criteria established and the control system configuration under change control.
2. Scope and Validation Strategy
This article covers process qualification for a specific product and includes:
- Cycle development readiness and prerequisite data
- Definition of CQAs and CPPs
- PPQ strategy and run design
- Sampling plan and test methods
- Acceptance criteria and pass fail decisions
- Data review, reporting, and continued verification expectations
Excluded from this section:
- Detailed thermodynamic cycle development methods beyond qualification needs
- Detailed sterilization and aseptic process validation outside lyophilizer interfaces
3. Prerequisites Before Process Qualification
Process qualification requires documented readiness in the following areas.
3.1 Equipment and Facility Readiness
- Lyophilizer qualified and released for use
- Utilities qualified and stable
- Calibration status current for critical instruments
- Preventive maintenance status acceptable
- Environmental classification and monitoring program established where applicable
3.2 Method Readiness
- Validated or qualified analytical methods for key CQAs
- Sampling tools and procedures approved
- Data capture and audit trail functionality verified
3.3 Process and Material Readiness
- Approved formulation and manufacturing instructions
- Defined container closure system, stopper, and crimp configuration
- Defined load configuration, tray configuration, and maximum shelf load
- Defined freezing strategy and nucleation approach, if used
4. Process Understanding and Cycle Definition
Process qualification must be anchored in documented process development data. Each phase of the lyophilization cycle must be justified using formulation properties, thermal characterization data, and prior scale-up knowledge. The defined cycle is not a collection of setpoints; it is a controlled thermodynamic sequence designed to manage phase transitions, mass transfer, and product stability.
Cycle parameters must remain within the validated operating envelope established during equipment qualification.
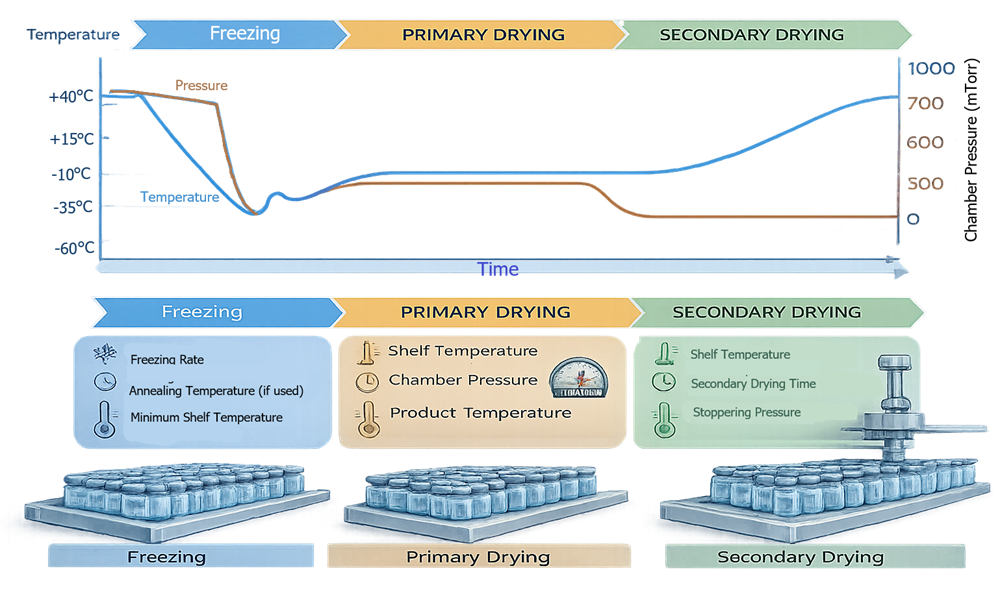
CPP to CQA CorreThe lyophilization cycle consists of three thermodynamically distinct phases: freezing, primary drying, and secondary drying. The illustration should present a temperature and pressure versus time profile, clearly marking phase transitions and identifying major CPPs within each segment. This visualization reinforces that process qualification evaluates controlled phase behavior rather than isolated setpoints.
4.1 Freezing Phase
The freezing phase establishes the ice crystal structure that will govern mass transfer resistance during primary drying. Ice morphology directly affects drying rate and cake structure.
Freezing Rate and Shelf Setpoint Strategy
The freezing rate determines ice crystal size:
- Rapid freezing produces small ice crystals and higher mass transfer resistance.
- Slower freezing produces larger ice crystals and lower resistance.
Shelf temperature setpoints must be selected to control nucleation behavior and limit supercooling variability. Inconsistent nucleation across vials results in batch heterogeneity.
The freezing profile should define:
- Initial ramp rate to freezing setpoint
- Target minimum product temperature
- Duration of freezing hold
Hold Time for Complete Solidification
A defined hold period ensures complete solidification throughout the entire vial volume. Insufficient hold time risks residual liquid pockets, which can lead to structural collapse during pressure reduction. Solidification must be confirmed through development studies and product thermocouple data.
Optional Annealing Step
Annealing may be incorporated to:
- Increase ice crystal size
- Reduce amorphous phase heterogeneity
- Improve primary drying efficiency
Annealing involves warming the product to a temperature below collapse temperature but above the glass transition temperature of the maximally freeze-concentrated solution, followed by controlled re-cooling. The rationale for annealing must be supported by development data demonstrating improved drying uniformity or reduced variability.
Target Product Temperature Limits
Freezing temperature must be sufficiently below the eutectic or glass transition temperature to ensure structural stability prior to pressure reduction.
Risks Controlled During Freezing
- Non-uniform ice structure leading to drying variability
- Structural defects from excessive supercooling
- Vial breakage due to rapid thermal stress
- Phase separation or crystallization instability
Improper freezing conditions cannot be corrected in later phases.
4.2 Primary Drying Phase
Primary drying removes bulk ice through sublimation under reduced pressure. This phase is governed by heat input, chamber pressure, and vapor flow capacity.
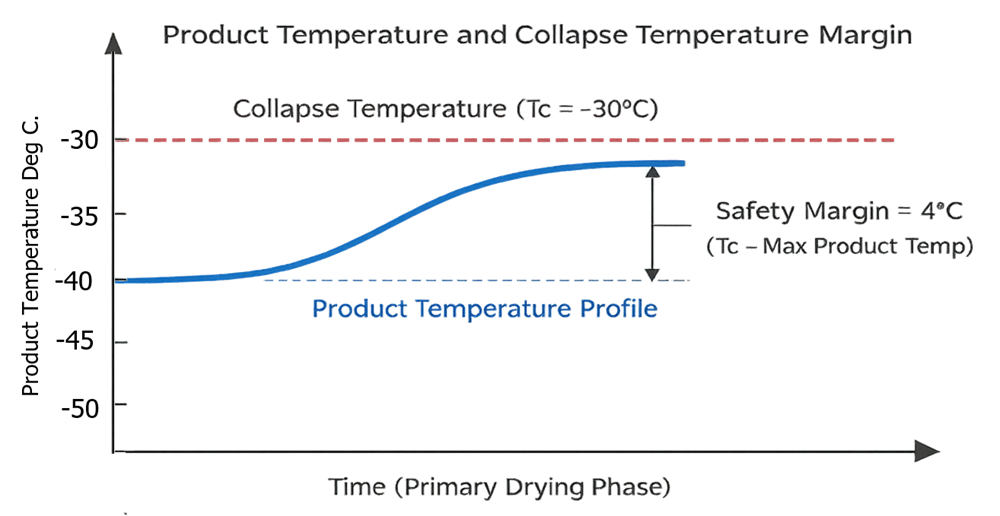
Maintaining product temperature below the collapse temperature is central to structural integrity. The illustration should depict product temperature trend relative to collapse temperature limit, highlighting the safety margin required during primary drying. This visual emphasizes why shelf temperature and pressure setpoints must be justified and controlled.
Chamber Pressure Setpoint and Control Mode
Chamber pressure influences sublimation rate and product temperature.
- Lower pressure increases driving force but may limit heat transfer.
- Higher pressure improves heat transfer but risks product temperature exceeding collapse limits.
Pressure must be controlled using a capacitance manometer as the primary reference. Control stability and oscillation limits must be predefined.
Shelf Temperature Setpoint and Ramp Profile
Shelf temperature supplies the latent heat of sublimation. The shelf setpoint must be selected to:
- Maintain product temperature below collapse temperature
- Provide sufficient energy for efficient sublimation
- Avoid excessive ramp rates that destabilize structure
Ramp profiles must consider heat transfer resistance through dried cake layer.
Target Product Temperature Limits
Product temperature must remain below:
- Collapse temperature for amorphous systems
- Eutectic temperature for crystalline systems
Development studies should define a safe margin between operating temperature and structural failure threshold.
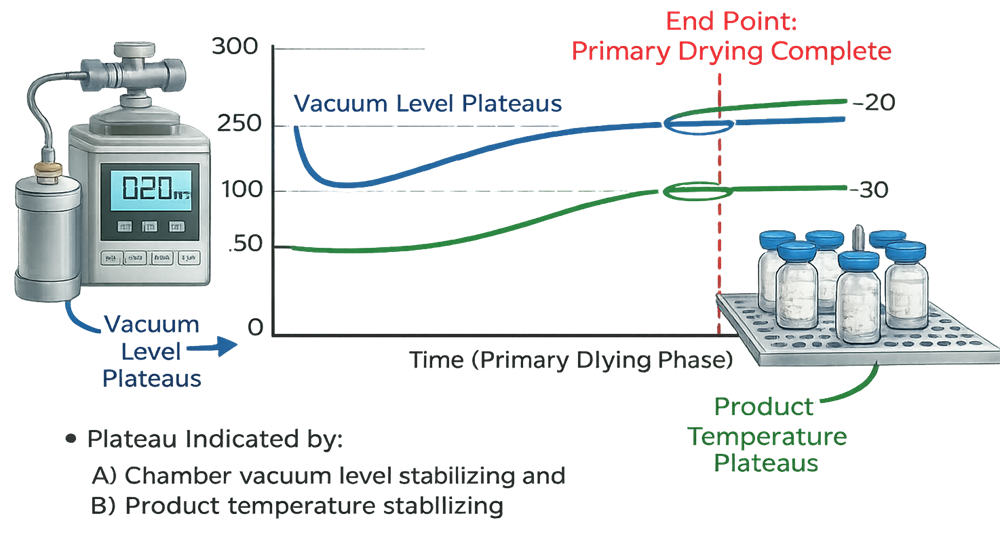
Endpoint Determination Method
Primary drying endpoint must be defined using objective, predefined criteria rather than fixed time assumptions. During active sublimation, water vapor generation causes divergence between the Pirani gauge and the capacitance manometer. The Pirani signal is influenced by vapor concentration, while the capacitance manometer measures true absolute pressure. As long as ice remains, the Pirani reading remains elevated relative to the capacitance manometer.
When bulk ice is fully removed, vapor flow decreases and the two pressure readings converge. This convergence is a recognized indicator that sublimation is complete.
An alternative confirmation approach is the pressure rise test. The chamber is isolated from the condenser under controlled conditions. If residual ice is present, continued sublimation causes measurable pressure increase. If pressure remains stable within a predefined limit over a defined time interval, it supports confirmation of primary drying completion.
Additional confirmation methods may include:
- Product thermocouple stabilization at expected steady-state values
- Mass balance calculations based on condenser load and expected ice removal
Endpoint criteria must be quantitatively defined in the qualification protocol. Examples include:
- Maximum allowable difference between Pirani and capacitance readings
- Maximum allowable pressure rise during isolation
- Minimum stabilization duration
- Defined product temperature plateau behavior
Extending primary drying without predefined criteria introduces unnecessary cycle time variability and reduces process control.
The illustration should depict Pirani and capacitance manometer convergence and/or a pressure rise test curve with an acceptance threshold, reinforcing that endpoint determination is verified against objective limits established during qualification.
Risks Controlled During Primary Drying
- Collapse or meltback due to exceeding structural temperature
- Incomplete sublimation resulting in residual ice
- Condenser overload causing pressure instability
- Excessive drying time variability
Primary drying is the most critical structural phase of the cycle.
4.3 Secondary Drying Phase
Secondary drying removes bound water through desorption at elevated temperature.
Shelf Temperature Profile and Hold Duration
Shelf temperature is increased gradually to avoid cake disruption. Elevated temperature enhances moisture diffusion from the solid matrix. The final temperature and hold duration must be justified based on:
- Moisture sorption characteristics
- Product thermal stability
- Degradation kinetics
Overly aggressive temperature increases may cause:
- Product degradation
- Color change
- Potency loss
Target Residual Moisture Endpoint
Residual moisture acceptance limits must be predefined and linked to stability data. Secondary drying must achieve moisture levels that:
- Support labeled shelf life
- Prevent hydrolytic degradation
- Maintain structural integrity
Sampling must represent worst-case positions identified during mapping.
Backfill and Stoppering Strategy
At the conclusion of secondary drying:
- Chamber pressure is controlled during vacuum break
- Inert gas backfill may be used to control headspace composition
- Stoppering is executed under controlled pressure
The rate of backfill must be controlled to avoid disturbing the dried cake.
Risks Controlled During Secondary Drying
- Excess residual moisture impacting stability
- Over-drying causing degradation
- Variability in final water content across load
- Improper headspace conditions affecting oxidation-sensitive products
Secondary drying establishes the final product moisture and long-term stability profile.
Each phase of the lyophilization cycle must be justified scientifically and supported by development data. Process qualification confirms that, when executed within defined parameters, these phases consistently produce product meeting established critical quality attributes.
5. Critical Quality Attributes and Critical Process Parameters
Process qualification must demonstrate a defined and scientifically justified relationship between Critical Process Parameters (CPPs) and Critical Quality Attributes (CQAs). CPP identification must be supported by development studies, thermal characterization data, and formal risk assessment.
CQAs represent the measurable attributes of the finished lyophilized product.
CPPs represent the controlled variables within the lyophilization cycle that directly influence those attributes.
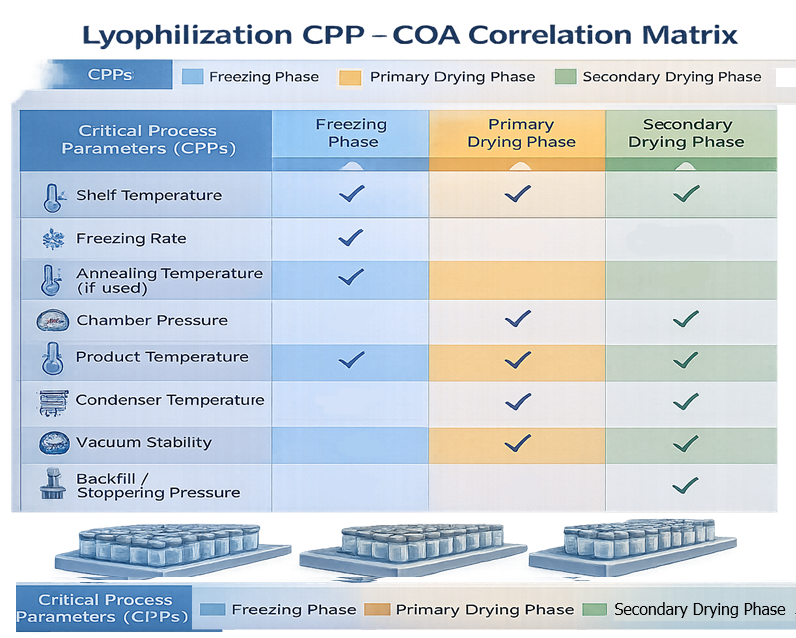
Process qualification requires explicit linkage between critical process parameters and critical quality attributes. The illustration should present a simplified matrix showing which CPPs influence specific CQAs across different cycle phases. This diagram supports risk-based validation logic and clarifies how control of shelf temperature, chamber pressure, and product temperature protects structural integrity and stability.
5.1 Critical Quality Attributes (CQAs) for Lyophilized Products
Typical CQAs include:
Residual Moisture
Residual moisture directly impacts chemical stability, degradation kinetics, and long-term shelf life. Moisture content must be controlled within validated limits derived from stability data.
Reconstitution Time
Reconstitution time reflects cake porosity and structural integrity. Excessively dense or collapsed cakes may increase reconstitution time.
Appearance and Cake Structure
Cake defects may include collapse, meltback, shrinkage, cracking, or blowout. Visual structure reflects proper control of freezing and primary drying conditions.
Potency and Related Substances
Thermal stress or extended drying may accelerate degradation pathways. Process parameters must not compromise potency.
pH After Reconstitution
Changes in residual moisture or formulation stability may alter pH, affecting product performance.
Particulate Matter and Container Closure Integrity
Improper stoppering or mechanical misalignment may compromise closure integrity. Mechanical performance must support sterility assurance.
Sterility Assurance
For aseptically filled products, sterility is preserved through environmental control and proper stoppering under vacuum or inert gas backfill.
5.2 Critical Process Parameters (CPPs) by Phase
CPPs must be correlated to specific cycle phases and linked to the CQAs they influence.
A. Freezing Phase CPPs
Shelf Cooling Rate
Influences ice crystal size and cake pore structure.
Linked CQAs: Reconstitution time, residual moisture variability, appearance.
Minimum Product Temperature Achieved
Ensures full solidification below glass transition or eutectic temperature.
Linked CQAs: Cake integrity, structural stability.
Freezing Hold Time
Ensures complete solidification throughout vial volume.
Linked CQAs: Uniform drying behavior, avoidance of collapse.
Annealing Temperature and Duration (if used)
Controls ice morphology and crystallization behavior.
Linked CQAs: Drying efficiency, residual moisture uniformity.
Risk linkage: Inconsistent freezing leads to heterogeneous mass transfer resistance and inter-vial variability.
B. Primary Drying Phase CPPs
Shelf Temperature Setpoint and Ramp Rate
Controls energy input to sustain sublimation.
Linked CQAs: Cake structure, residual moisture, degradation risk.
Chamber Pressure Setpoint
Defines sublimation driving force and heat transfer efficiency.
Linked CQAs: Structural integrity, drying time, moisture content.
Product Temperature at Representative Locations
Must remain below collapse temperature or eutectic limit.
Linked CQAs: Appearance, cake structure, reconstitution time.
Condenser Temperature and Capacity Margin
Ensures effective vapor capture and pressure stability.
Linked CQAs: Uniform drying, avoidance of incomplete sublimation.
Pressure Stability and Oscillation Control
Prevents product temperature excursions.
Linked CQAs: Structural integrity and batch uniformity.
Risk linkage: Exceeding collapse temperature directly causes irreversible cake defects.
C. Secondary Drying Phase CPPs
Shelf Temperature Profile During Desorption
Controls moisture removal rate and degradation risk.
Linked CQAs: Residual moisture, potency, stability.
Secondary Drying Hold Time
Determines final moisture content.
Linked CQAs: Shelf life, chemical stability.
Final Product Temperature Plateau
Confirms desorption phase completion.
Linked CQAs: Moisture uniformity.
Risk linkage: Under-drying leads to elevated residual moisture; over-drying may increase degradation.
D. End-of-Cycle and Mechanical CPPs
Backfill Pressure and Rate
Prevents cake disturbance and controls headspace oxygen levels.
Linked CQAs: Cake integrity, oxidation-sensitive potency.
Stoppering Travel and Final Seating Height
Ensures container closure integrity.
Linked CQAs: CCI performance, sterility assurance.
Vacuum Break Control
Prevents mechanical stress or turbulence.
Linked CQAs: Appearance and structural integrity.
Risk linkage: Mechanical inconsistency may not affect drying but can compromise sterility and stability.
5.3 CPP–CQA Correlation Framework
Each CPP must be:
- Scientifically justified
- Measurable and trendable
- Assigned acceptable operating ranges
- Linked to at least one CQA through documented risk assessment
The validated operating ranges defined during process qualification must ensure that when CPPs remain within limits, CQAs consistently meet specifications.
This correlation forms the basis for continued process verification and lifecycle management of the lyophilization process.
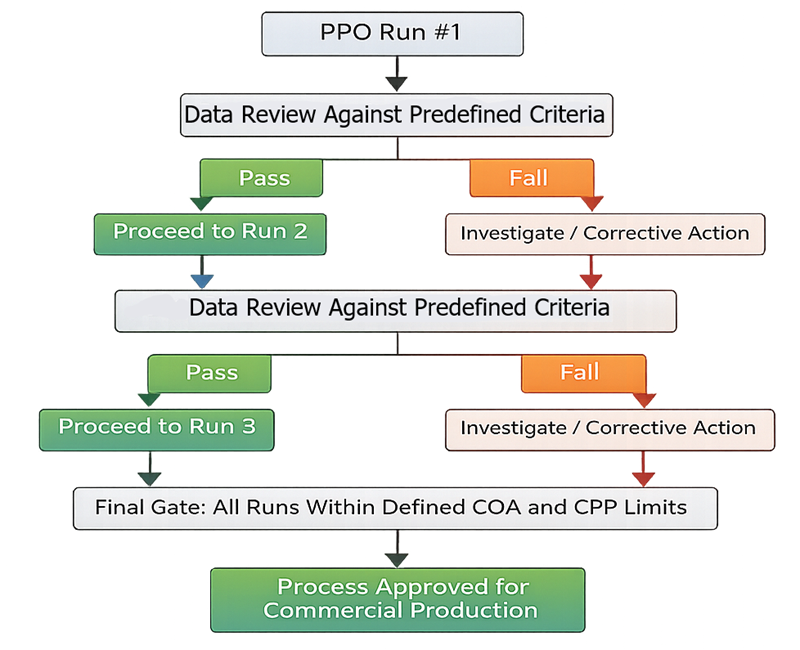
6. PPQ Run Strategy
Process Performance Qualification is executed as a sequence of consecutive commercial-scale batches evaluated against predefined acceptance criteria. After each PPQ run, critical quality attributes and critical process parameters are formally reviewed before proceeding to the next batch. Failure to meet established limits triggers investigation and corrective action prior to continuation. Final approval for routine commercial production is granted only when all consecutive runs demonstrate consistent performance within defined CQA and CPP limits. This structured decision flow reinforces reproducibility, predefined pass/fail logic, and objective release criteria.
6.1 Number of Runs and Run Design
A typical approach uses consecutive PPQ runs at intended commercial scale using:
- Normal operating conditions
- Defined worst-case load configuration, if applicable
- Defined edge-of-shelf and center-of-shelf sampling locations
The strategy must specify whether runs are:
- All at nominal conditions
- Bracketing or matrixed for known worst-case variables
- Including planned hold time challenges, if supported by risk assessment
6.2 Load Pattern Definition
Define:
- Vial count, fill volume, and vial type
- Tray arrangement and shelf loading pattern
- Probe vial placement and rationale
- Edge and center mapping strategy
Load pattern must be controlled. Uncontrolled variation invalidates comparability across PPQ runs.
7. Sampling and Testing Plan
The sampling plan must demonstrate both intra-batch and inter-batch consistency.
7.1 Sampling Locations
Sampling shall include:
- Edge positions
- Intermediate positions
- Center positions
- Multiple shelves, including top and bottom shelves where applicable
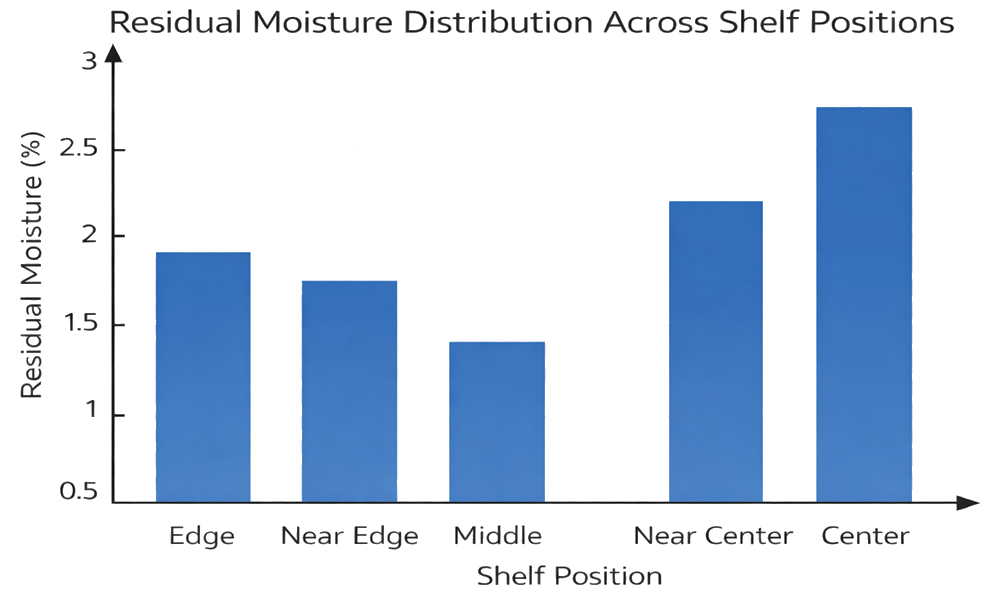
- Identified thermal worst-case regions based on OQ temperature mapping
Residual moisture must demonstrate consistency across all defined spatial locations to confirm uniform drying performance. The illustration depicts a shelf map with representative sampling points and comparative moisture values. “Middle” refers to an intermediate zone between the perimeter and the geometric center, while “Center” designates the true central position of the shelf. Evaluation of these locations supports assessment of both intra-shelf and inter-shelf variability during PPQ and confirms that heat transfer and vapor flow distribution remain controlled and uniform across the load.
7.2 Typical Tests During PPQ
- Residual moisture by approved method
- Appearance and cake defect inspection
- Reconstitution time
- Assay and impurities
- Headspace oxygen, if nitrogen backfill is critical
- Container closure integrity where required
- Sterility testing per applicable program, if within scope
7.3 In-Process Data Requirements
- Shelf temperature trends
- Chamber pressure trends
- Product thermocouple trends
- Alarm and event logs
- Batch record completion review
8. Acceptance Criteria
Process acceptance criteria define the quantitative limits that determine whether PPQ demonstrates a state of control. These criteria must be established, justified, and approved prior to execution of PPQ batches. Acceptance limits are derived from development data, stability data, equipment capability, and risk assessment linking CPPs to CQAs.
Acceptance criteria operate at three levels:
- Product quality level (CQAs)
- Process performance level (CPPs)
- Batch-to-batch reproducibility level
8.1 Product-Level Acceptance Criteria (CQA-Based)
Each critical quality attribute must have predefined specification limits. These typically include:
- Residual moisture maximum limit
- Appearance and cake structure conformity
- Reconstitution time limit
- Potency and impurity limits
- Headspace or closure integrity criteria where applicable
In addition to meeting specification, PPQ must demonstrate spatial consistency across defined sampling locations, including edge, intermediate, and center positions and multiple shelves where relevant. Localized compliance with global variability is not sufficient; distribution uniformity must be demonstrated.
8.2 Process-Level Acceptance Criteria (CPP-Based)
CPP limits define the validated operating range within which product quality is assured. These include:
- Shelf temperature limits and ramp tolerances
- Chamber pressure limits and stability thresholds
- Product temperature limits relative to collapse temperature
- Condenser temperature performance limits
- Vacuum stability and leak integrity thresholds
- Backfill pressure and stoppering limits
Allowable excursions must be predefined. Minor transient deviations may be acceptable if supported by risk assessment and demonstrated lack of CQA impact. Major excursions beyond validated limits require formal investigation and potential batch rejection.
8.3 Run-to-Run Reproducibility Criteria
PPQ must demonstrate reproducibility across consecutive commercial-scale batches. Acceptance criteria may include:
- Statistical comparability of key CQAs across runs
- Defined variability limits for residual moisture distribution
- Comparable CPP trend profiles
- No unresolved critical deviations
Reproducibility confirms that the process is not merely capable once, but consistently controllable.
8.4 Alarm Handling and Deviation Thresholds
All critical alarms triggered during PPQ must be evaluated against predefined decision logic. Acceptance criteria must define:
- Which alarms are informational versus critical
- Maximum allowable duration for process interruptions
- Conditions requiring batch termination
- Documentation and investigation requirements
Qualification cannot rely on post hoc justification. Acceptance rules must exist before data is generated.
8.5 Validated Process Operating Envelope
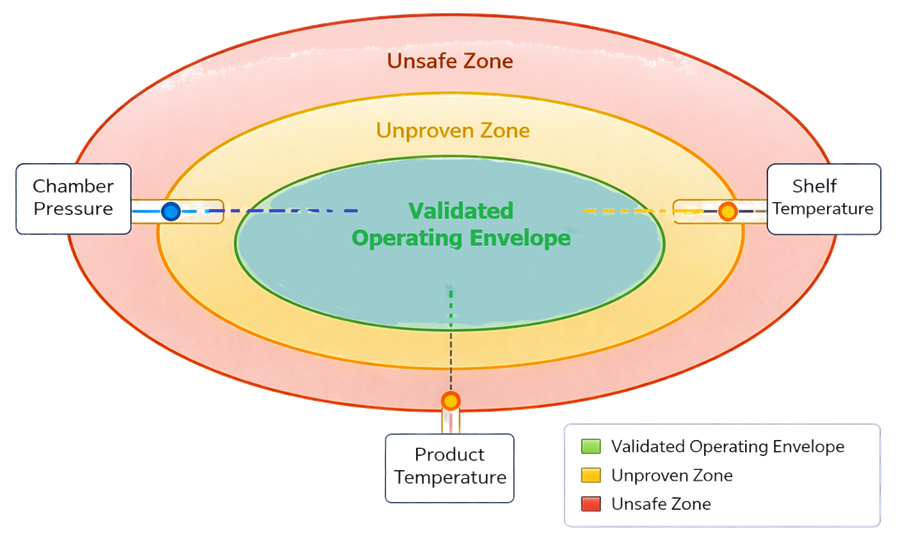
The validated process operating envelope represents the multidimensional range of CPPs within which product CQAs are consistently achieved. In the illustration, the central green region represents the validated operating space established during qualification. The surrounding yellow region represents parameter combinations that are unproven and not supported by qualification data. The outer red region represents conditions that are unsafe or known to risk structural failure, instability, or nonconformance.
The diagram emphasizes that:
- Individual parameters may be within limit, yet combinations may fall outside the validated envelope.
- Acceptance is based on operation within the validated region, not merely within isolated parameter specifications.
- Movement toward the boundary reduces safety margin and increases risk.
The envelope logic reinforces that PPQ acceptance criteria are not isolated numeric limits but an integrated control space linking shelf temperature, chamber pressure, and product temperature to product quality outcomes.
Any excursion beyond predefined CQA or CPP limits requires documented impact assessment, formal deviation handling, and disposition decision before the batch may be considered acceptable. Acceptance criteria define the boundary between validated control and unacceptable process risk.
9. Deviations, Investigations, and Disposition
The qualification plan must define:
- What constitutes a minor deviation versus a major deviation
- Criteria that trigger run rejection or repetition
- Requirements for root cause analysis and corrective actions
- Product disposition decision roles and documentation expectations
Deviations impacting CPP control or CQAs generally require repeat execution or additional justification supported by data.
10. PPQ Report and Release
The final report should include:
- Summary of run execution and comparability
- CQA results with location-based analysis
- Trend review of CPPs and key equipment indicators
- Alarm and deviation summary with disposition
- Conclusion on cycle qualification status and approved operating ranges
Release of the process to routine production requires approved PPQ report and establishment of continued verification requirements.
11. Continued Process Verification
After PPQ, continued verification should include routine trending of:
- Shelf temperature and chamber pressure stability
- Cycle duration and endpoint behavior
- Residual moisture and reconstitution time
- Key alarms and maintenance events
- Condenser performance indicators
Requalification triggers should be defined for:
- Major equipment change or control system change
- Significant recipe changes
- Repeated deviation trends
- Changes to container closure system or loading pattern